Discover the art scene at WashU.
Unleash your creativity at WashU, where a vibrant visual arts scene offers unparalleled opportunities to explore, create, and exhibit your artistic vision.
Kemper Art Museum
WashU is home to one of the nation’s leading university art museums. Located on the east end of the Danforth Campus, the Mildred Lane Kemper Art Museum has some 8,700 artworks in its collection, with especially strong holdings of 19th-, 20th-, and 21st-century European and American art and a growing range of international art. The museum’s active exhibition program presents the work of important contemporary artists as well as historical art in thought-provoking thematic explorations of issues relevant to today’s world.
Art on Campus
Explore WashU’s Art on Campus program, where striking public artworks by nationally recognized artists are integrated throughout our vibrant environment. These installations not only beautify but also inspire thought and dialogue for everyone on campus.
Student arts organizations
Students interested in promoting art on campus can join the Sam Fox Arts Council, which organizes events like gallery showcases, workshops, and a semesterly ArtMart flea market.
WashU operates a local chapter of the national American Institute of Graphic Arts (AIGA), which offers students interested in design and illustration the ability to connect with their peers across the country while also hosting several professional, educational, and social art events on campus.
Students who want to combine their passions for the arts and community service can join Hearts for Arts: a student group which facilitates artistic experiences for children and hospital patients in the St. Louis community.
WashU has multiple student-run art publications, including Spires Magazine, which showcases student literature and visual art, and Armour Magazine, which showcases student fashion. Students can submit their own work to these magazines for publication, or work behind the scenes as editors and publishers.
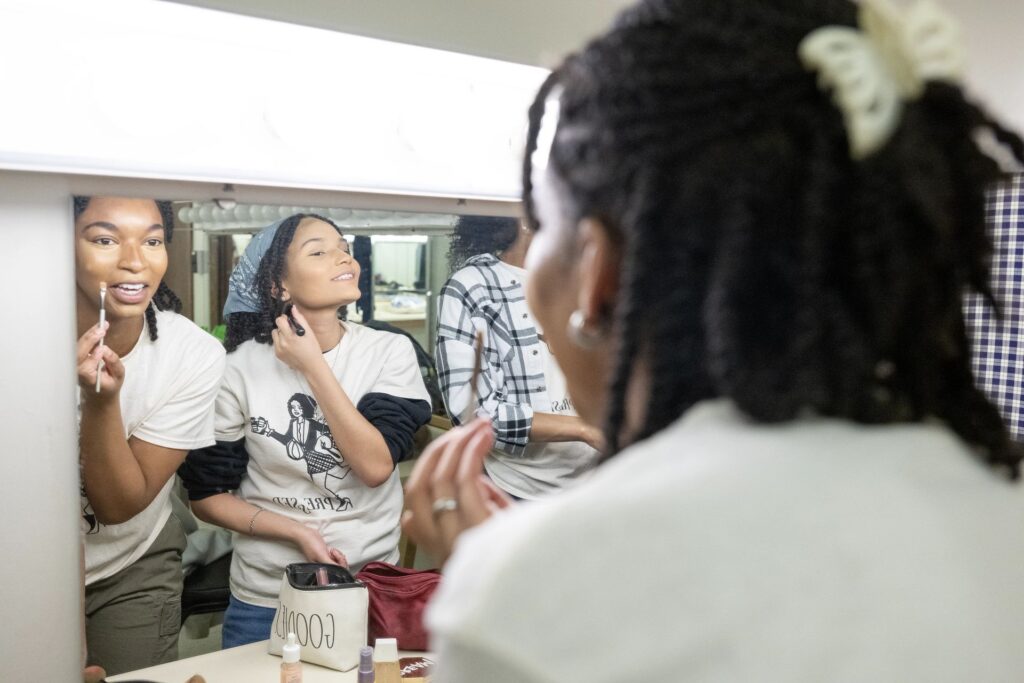
Take the stage. Find your crew. Share your voice.
Nearly two-thirds of WashU students take part in performing arts and music opportunities on campus.
Performing Arts Department
The Performing Arts Department (PAD) is dedicated to teaching theater and dance as a fundamental part of a liberal arts education based in a research university. Throughout the academic year, PAD hosts a myriad of performances open to the campus and surrounding communities.
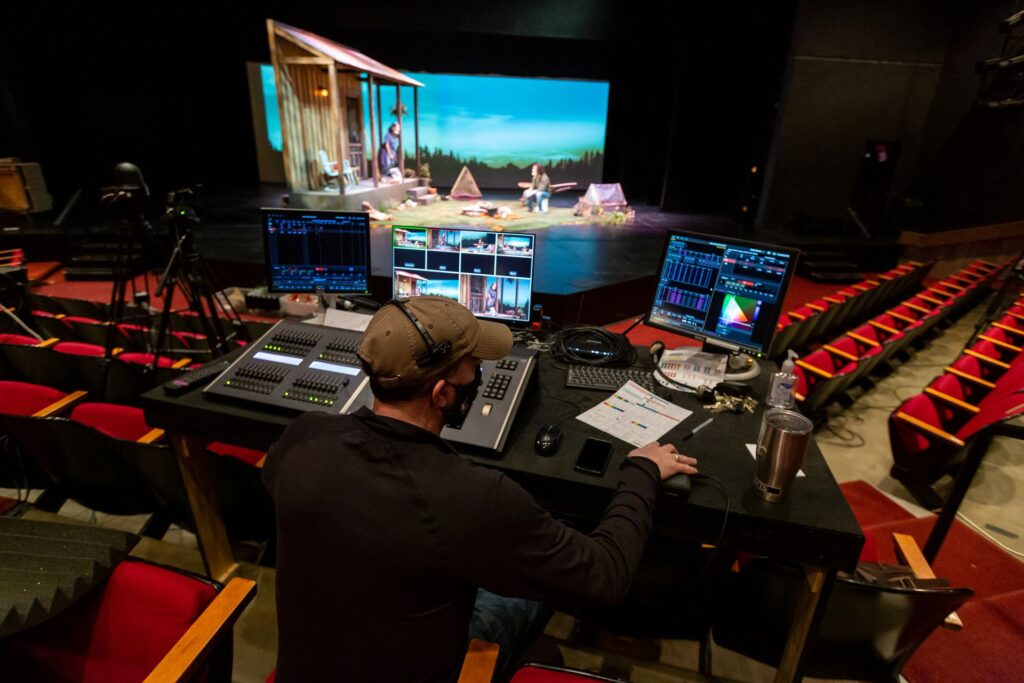
Edison Theatre
Edison Theatre is a fully technically equipped theater on the Danforth Campus. Edison serves as a teaching facility for the Performing Arts Department, which produces three mainstage Edison shows each year. It also serves as a performance venue for WashU student organizations, such as the Lunar New Year Festival performance and Carnaval.
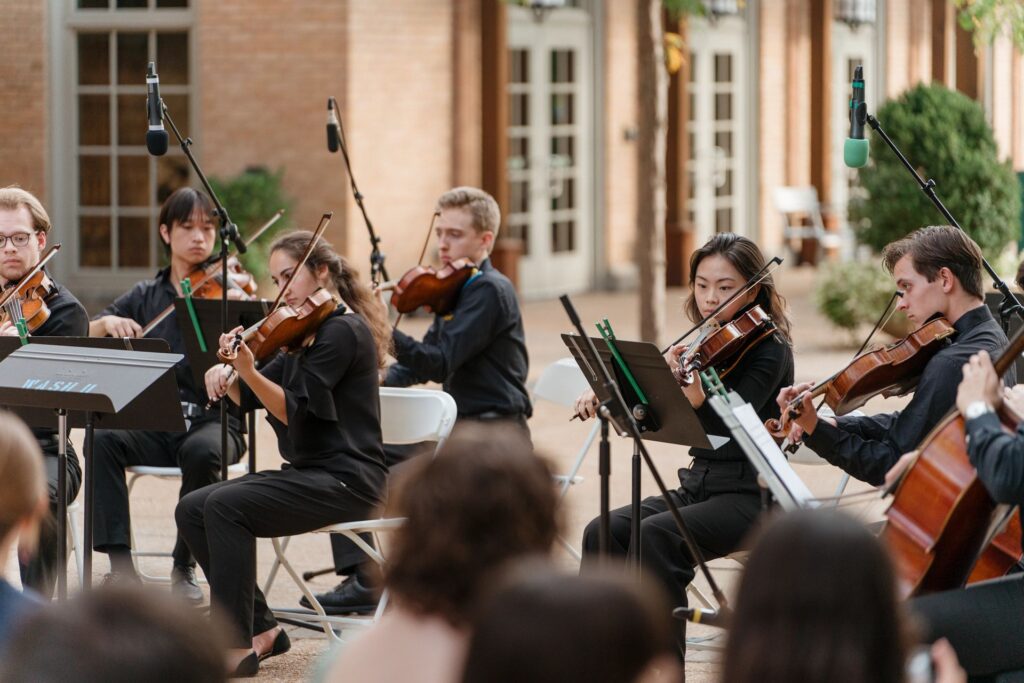
Department of Music
The Department of Music fosters a lively and exciting musical environment on campus, providing students with opportunities for WashU students to enrich their education through studying music. Each semester, the department offers an extensive season of performances by WashU’s own soloists, ensembles, and symphony, as well as nationally and internationally known musicians. The department also partners with the St. Louis Symphony Orchestra for feature performances throughout the year.
A Cappella
WashU offers more than 13 a cappella groups on campus, each with a distinct theme and flair. To name a few, WashU is home to the Aristocrats, The Ghost Lights, and More Fools Than Wise. These groups sing your favorite Disney tunes, Broadway songs, and jazz pieces, respectively. Some groups have even received national recognition such as The Amateurs, who have performed on America’s Got Talent, and The Mosaic Whispers, who have recorded with musician Ben Folds.
Comedy
WashU’s three improv comedy groups give students a chance to think — and be funny — on their feet. Students can watch or audition for Mama’s Pot Roast, KARL, and Suspicious of Whistlers, improv groups who bring laughter and joy to the entire campus.
Students who want to try their hand at writing and acting comedy sketches can join Kids on Campus, WashU’s only sketch comedy group. Kids on Campus performs an SNL-style live sketch comedy show every semester, where all sketches are written by students.
WashU also has a thriving stand-up scene. With student groups WUSUCC and The Mic, students can participate in open mics, join a performance team, and laugh at some hilarious onstage comedy.
Student theatre
It has been said that “All the world’s a stage,” and the WashU Quadrangle is no exception. Each April, members of All Student Theatre turn the Quad into an outdoor student-run theater. Every aspect of the show — producing, designing, and performing — is done by students.
Another fully student-run performing group is Thyrsus, the oldest student group on campus. Thyrsus puts on an annual Day of Shame performance for which they write, direct, and perform a series of short plays within a 24-hour time span.
The third student theater group on campus is Cast n’ Crew, focusing on black box style and often cult-classic theater productions. They produce one show in the fall and spring.
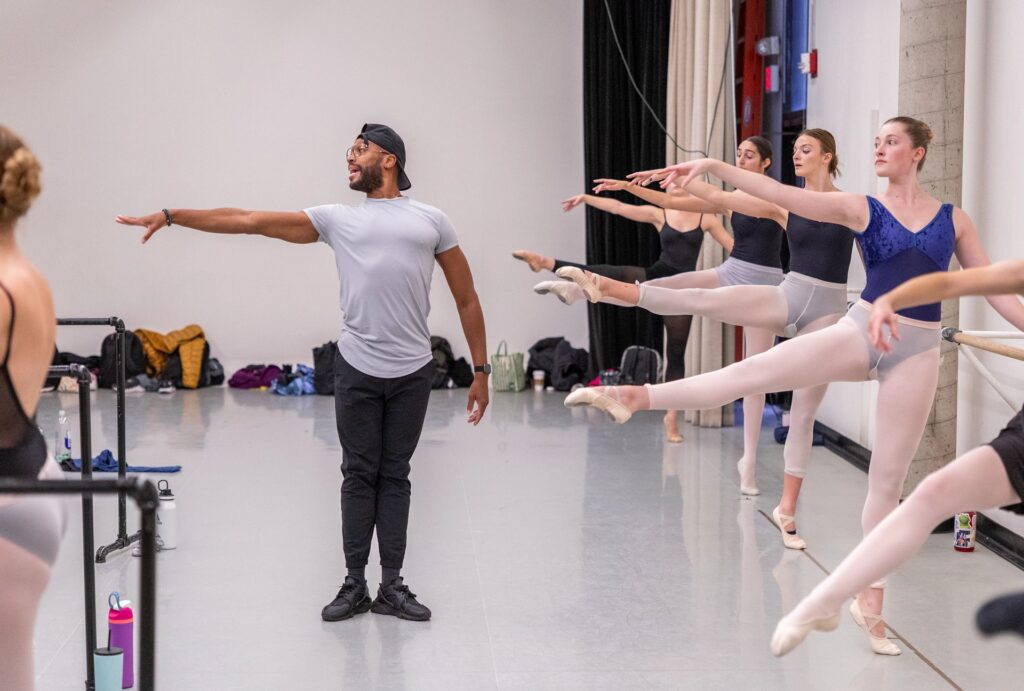
Dance
WashU has various dance groups to meet students’ interests. Some dance groups include WUSauce, PL4Y, and WUHUU, specializing in salsa, K-pop dance covers, and hip-hop, respectively. Whether you have danced before or you are interested in learning, these groups offer free lessons and workshops to hone your dance skills!
WU-Slam
WU-Slam is the premier spoken word group at WashU. The core of WU-Slam is the Performance Crew, which consists of the executive board and a traveling performance group. However, WU-Slam also hosts a weekly poetry workshop, Inklings, that is open to all students, as well as monthly poetry slams, or spoken word competitions. The Grand Slam, held every fall, draws huge crowds to the Danforth University Center to watch students compete for spots on WashU’s National Slam Team.