Class of 2030 Profile
Our selection process is guided by a committee of admissions professionals in an effort to ensure that, together, our academic schools create a community that is welcoming, nurturing, and intellectually rigorous.
Please note: numbers are accurate as of September 21, 2026.
Applications
Applicants
33,214
applicants
4,057
admits
1,941
enrolling
Admit Rate
12%
Overall admit rate
Enrolling students by division
| Arts & Sciences | 1,330 |
| Business | 172 |
| Architecture | 61 |
| Art | 78 |
| Engineering | 300 |
| Beyond Boundaries | 47 |
Test scores
Middle 50%
SAT: 1510-1550
ACT: 33-35
Applicants
63% Applied with test scores
37% Applied without test scores
Enrolled
63% Enrolled with test scores
37% Enrolled without test scores
About our students
58% Public School / 41% Private School
53% Female / 47% Male
17% of class first-generation college
23% of class Pell eligible
13% International students
88% of students reporting rank were in the top 10% of their high school class
Geography
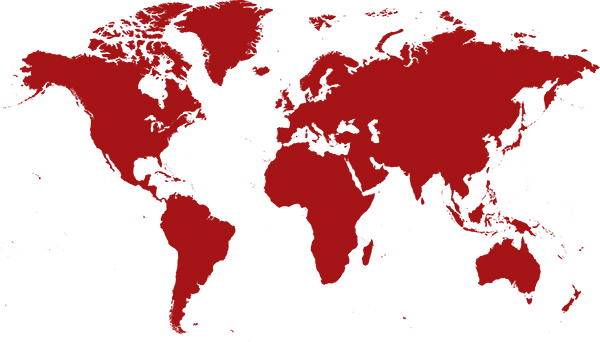
Members of the Class of 2030 are from 48 states and 29 countries
Plus the District of Columbia, Guam, and Puerto Rico.
- 31% Midwest
- 15% Middle States
- 17% West
- 10% South
- 8% Southwest
- 5% New England
- 64% From more than 500 miles away
- 15% Other countries and territories
Enrolling transfer students
41 enrolling from 33 universities